
manubes Release 1.6
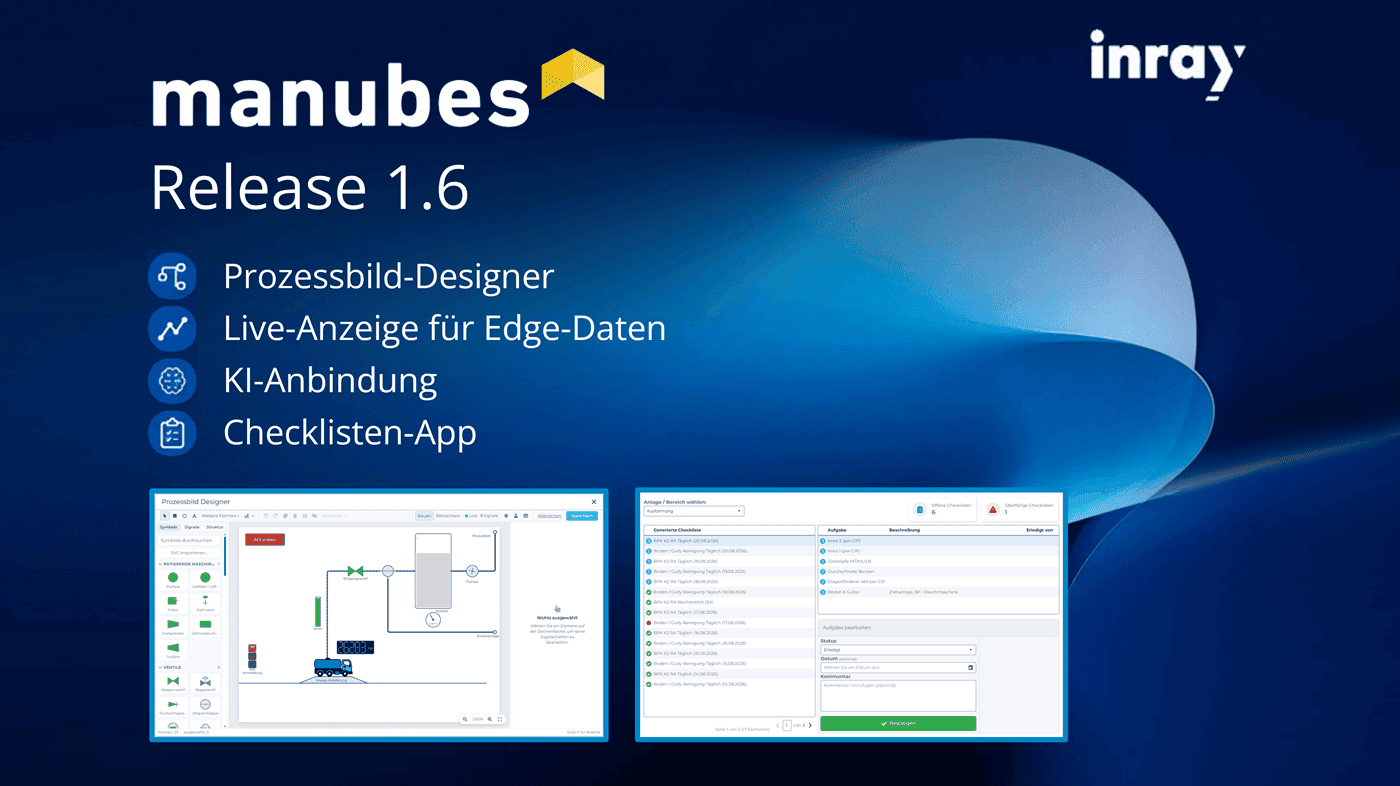
manubes Version 1.6 is now live, featuring exciting new capabilities in the areas of data transparency, process visualization, and AI integration.
- Process Visualization with the Process Image Designer
- Edge Data Overview for Live Visualization of Data Points
- Unified AI Integration for Various Providers
- Automatically filter views when they are called, and more: page variables and page parameters
- Landings Pages for Push Notifications: Targeted Navigation
- Translation Feature for Pages and Data Models: Multilingual Use
- New checklist application in the demo environment
All new features are now available in manubes. Create your free trial account to gain access to all of manubes' features.
For all the details on Release 1.6, click this LINK https://www.manubes.de/manubes-release-1-6/
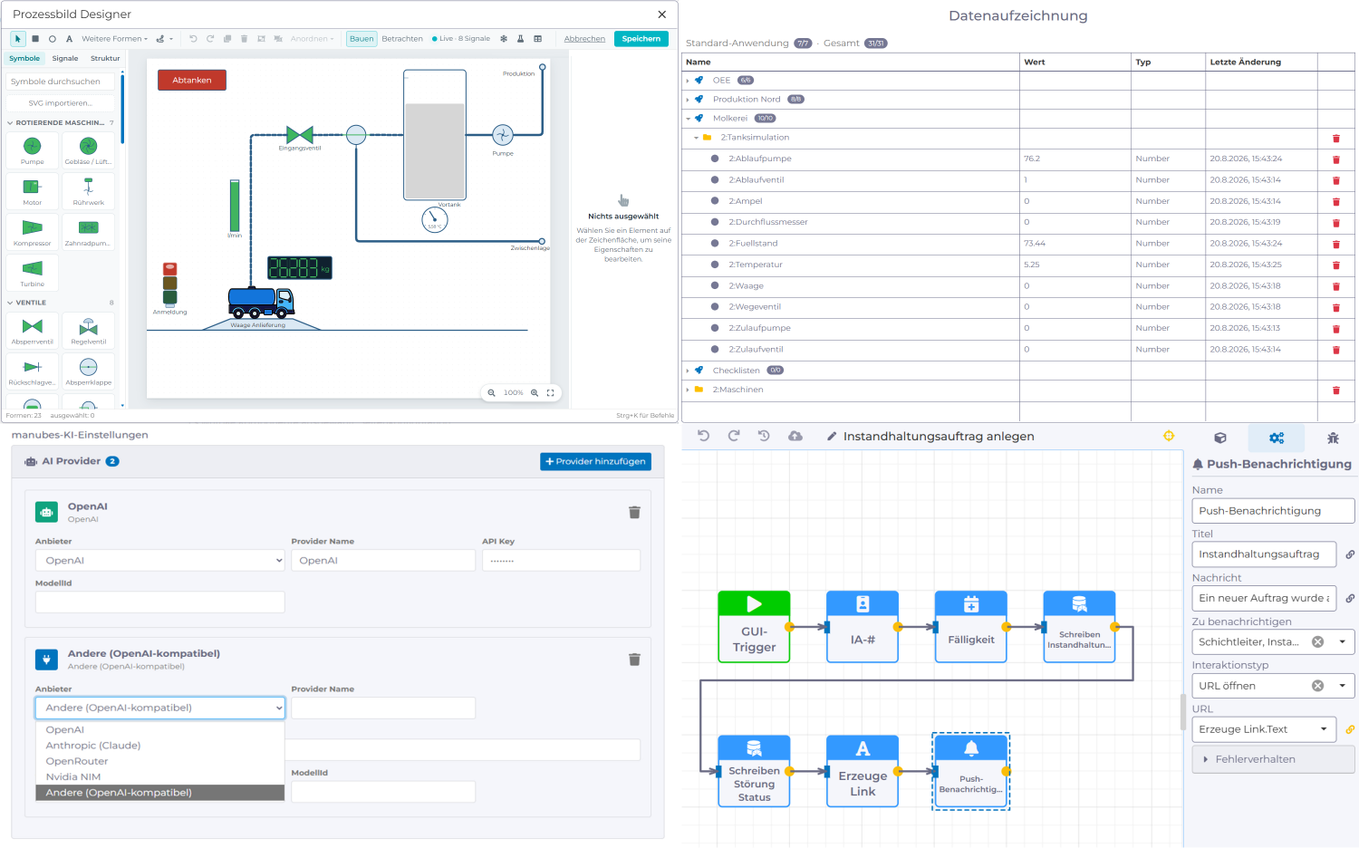
Process Diagram Designer: Graphic elements such as traffic lights, tanks, pumps, valves, and pipes can be combined using drag-and-drop to create custom plant diagrams and linked to data sources, rules, and animations. This makes live data—such as fill levels or valve statuses—visible directly in the process view. Examples: dairy receiving stations, CIP systems, conveyor lines.
Edge Data Overview: A new view providing a comprehensive overview of all connected data points and their live values. The data logging overview simplifies diagnostics; authorized users can view all active data sources and manage data points.
Standardized AI Integration: In the tenant settings, you can centrally connect various AI models and use them via the built-in AI assistant for data analysis and visualization.
Checklist Application: A new sample app in the demo environment shows how checklists can be created, managed, and used in production—from cleaning to quality inspections.
For more detailed information about Release 1.6, click this LINK https://www.manubes.de/manubes-release-1-6/